
This weekend was the French of Outremer Conference, hosted by Fordham University’s Center for Medieval Studies. It was an intriguing topic and a great crowd of people. Thoughtful conversations and exciting connections abounded over the course of one and a half days. For the first time, Fordham’s annual Medieval Studies conference adopted – and truly embraced – Twitter as a method of conference communication, using #FOO2014. The conference website incorporated a feed into its home page and had an officially designated and active handle @MVSTFordham.
Now that the conference is over, we are discussing ways to archive and share the conversations that took place through Twitter. A Storify is in the pipeline. [Update: Here is the Conference Storify, by Mel Kapitan, 4/25/14] In addition to that curation method, I adopted an archiving and visualization tool introduced to me by Christina M. Harlow: TAGSExplorer. Christina used this tool to document the ACRLNY Symposium in December 2013 to great success (her explanation of its use can be found here).
Martin Hawksey‘s free and open-source TAGS (Twitter Archiving Google Spreadsheet) and accompanying tutorial made my adoption of the tool possible. The result is an evolving archive of tweets using the conference #FOO2014 hashtag as well as a dynamic network visualization of the conversation. This is a screenshot of the visualization (it links to the dynamic site):
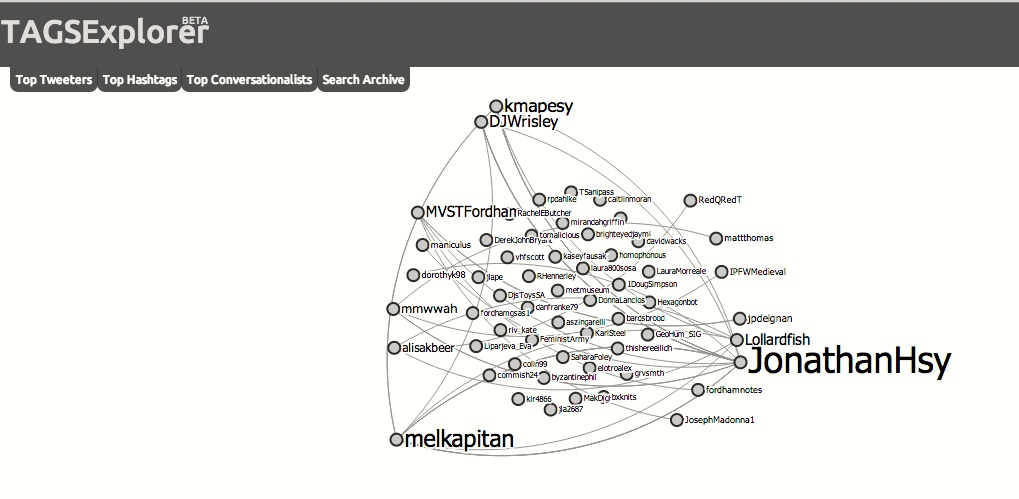
The visualization provides a snapshot of the most active participants at the conference while showing the variety of people involved. If only it also could show the number of people who were following along over the weekend but didn’t speak!
Aside from that dream data collection scenario, I recommend playing with the options on the site. In particular, the “top conversationalists” category provides a window into the engagement level of those tweeting at the event. I also suggest selecting an individual and replaying their tweets – the visual of seeing conversations happen over time is evocative indeed. In addition to providing the content for this great visualization, TAGS itself comprises a rich archive and data set for research. Here are a few images from the TAGS file for the French of Outremer Conference:
First, the Archive itself, which automatically updates with new tweets:

Second, the Summary page, which provides information on top participants, number of links, retweets, replies, etc:

Finally, the Dashboard transforms some of the data from the Summary into graphic displays and shows a detailed timeline of recent activity:

Integrating Twitter into the conversation – both virtual and face-to-face – at the French of Outremer Conference was a great success. Archiving and visualizing that success has several benefits:
1. It will allow for comparative analysis of virtual interactivity in future years, informing marketing choices and/or research in conference conversation habits.
2. It is an exciting way to understand the connections made, both for those who are documented in the visualization/archive and for those who want to see what was happening out of sight but didn’t participate via Twitter themselves.
3. It provides quantitative documentation of the humanities community, supporting budgetary allocations to humanities events by proving the visibility and interest level in the field.
I am delighted to come away from this weekend having learned how to use the Twitter API, educated by conversations on medieval mermaid imagery, and invigorated by witnessing first-hand enthusiasm for Digital Humanities in Medieval Studies.